

Introduction
A monthly utility bill can show that a plant used more energy, but it rarely explains which line, shift, or piece of equipment caused the increase. Without circuit-level data, managers are left comparing totals after the fact. A well-planned industrial energy monitoring system closes that gap by measuring consumption where decisions can still change the result.
For facility and energy managers, monitoring is useful when it connects electrical measurements to operating conditions: production volume, shift schedules, equipment status, and utility tariffs. Smart meters provide the data layer. Sensors, communications, dashboards, and a clear response process turn that data into action. The Department of Energy’s guidance on monitoring, measurement, and analysis makes the same practical point: organizations need to identify what to measure, collect usable data, and review it against energy performance goals.
What Industrial Energy Monitoring Should Measure
Start with the electrical variables that explain how a load behaves. Voltage and current show the conditions at the circuit. Active power (kW) describes the rate at which electrical energy is doing useful work; energy (kWh) accumulates that use over time. Reactive power (kvar), apparent power (kVA), and power factor help engineers understand how motors, transformers, and other inductive loads affect system capacity. Frequency and phase values add context where supply quality or imbalance may be an issue.
A single meter at the main incomer is useful for tracking site-wide demand, but it cannot pinpoint waste. Submeter large, energy-intensive processes and equipment groups first: compressors, pumps, chillers, ovens, production lines, and major distribution boards. This creates a manageable hierarchy—utility service, building or process, then selected assets—without attempting to instrument every small load at once.
For comparisons to be meaningful, define the boundary and time interval before collecting data. A line’s kWh per operating hour may reveal a change in efficiency; kWh per unit produced can separate energy performance from production volume. Demand peaks need interval data aligned with the utility’s billing period. Keep meter clocks synchronized and record operating states so a high reading can be connected to a real event.
Build a Measurement System That Fits the Site
An industrial energy monitoring system typically combines meters, current transformers where required, a communication path, and software that stores and presents readings. Meter selection begins with the electrical installation: phase and wire configuration, nominal voltage, expected current, whether direct connection or CT measurement is appropriate, accuracy requirements, panel space, and local rules for installation. CT ratio and polarity must be matched to the meter and wiring diagram; an incorrect ratio can make every downstream report misleading.
Communications matter as much as the meter. RS485 with Modbus-RTU is common for instrument networks, but the site still needs a defined addressing plan, baud rate, cable route, termination approach, and gateway or controller that can pass the data to the monitoring platform. Confirm that the intended building management system, SCADA platform, or energy software supports the chosen protocol and register map. A protocol label alone does not guarantee plug-and-play interoperability.
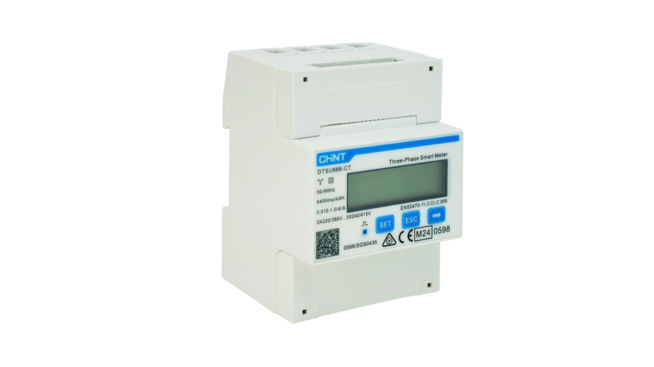
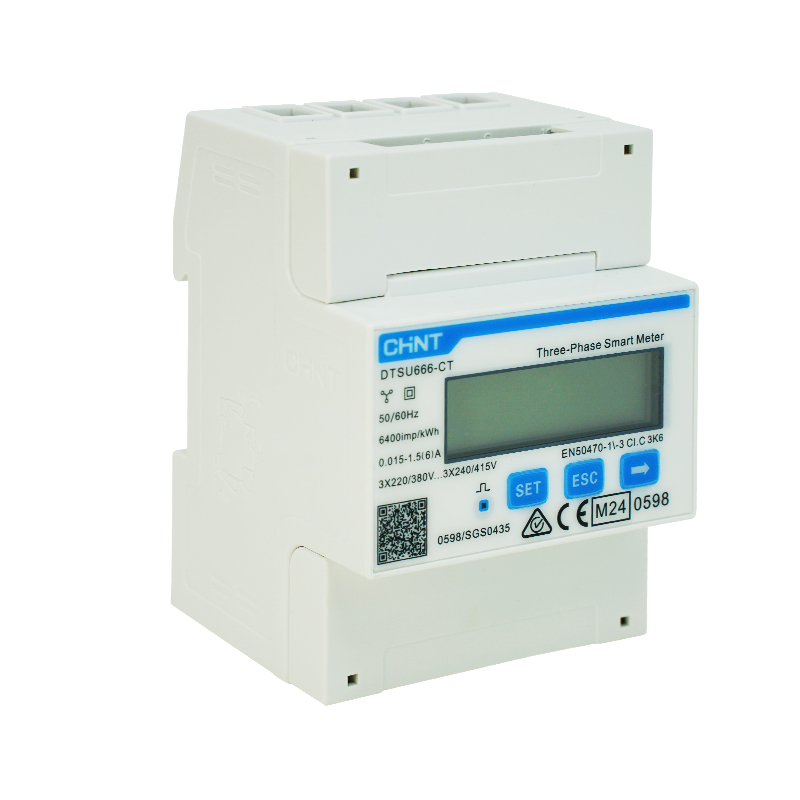
CHINT’s DTSU666-CT is a three-phase, four-wire CT-connected meter with RS485 Modbus-RTU communications. Its published measurement set includes import and export energy, active, reactive and apparent power, RMS voltage and current, frequency, and power factor. CHINT lists MID B+D certification and CT measurement accuracy of Class C/0.5S; confirm that the certification and measuring class fit the intended application. It is a DIN-rail instrument with an IP20 enclosure, so the panel environment and protection against contact or dust must be considered in the installation design. For switchboards where operators need to view several electrical parameters locally, CHINT’s PD7777 series is a panel-mounted display option with RS485 connectivity.

Turn Readings Into Operational Decisions
Monitoring does not reduce consumption by itself. The value comes from the questions it helps teams answer. If overnight baseload is higher than the established norm, check whether compressed-air leaks, extraction fans, or idle production equipment are still running. If a demand peak appears at shift change, review start-up sequencing and the overlap of large loads. If one motor circuit draws more current than comparable equipment, inspect the process duty, mechanical condition, and electrical supply before changing settings.
Use thresholds to focus attention, not to generate noise. A useful alert identifies the location, measured condition, time, and an assigned owner. Establish separate limits for warning and action, and account for normal start-up or batch cycles. Review trends at a frequency that matches the process: daily for operational anomalies, weekly for recurring patterns, and monthly for energy performance and cost review.
Pair electrical measurements with production or facility data whenever possible. A dashboard showing kWh alone may suggest a process is inefficient when it simply produced more. A normalized energy indicator, such as kWh per tonne or per operating hour, helps distinguish throughput changes from efficiency changes. Keep the calculation consistent and document any changes in meter boundaries or production definitions.
A Practical Rollout and Verification Plan
Begin with a short discovery phase. Review one year of utility bills, identify the site’s largest loads and costly demand intervals, and interview operations staff about the decisions they need to make. Use that information to select a first group of meters and define an energy baseline. A pilot on one production area can expose wiring, communications, and data-quality problems before the network expands.
Commission each meter against the single-line diagram. Verify phase mapping, CT ratio and direction, voltage references, communication settings, and displayed readings against a suitable reference instrument. Confirm that data arrives at the platform with the expected units, timestamps, and sign convention for import and export. Retain as-built drawings, meter addresses, register maps, and calibration or verification records.
Once the system is stable, assign owners to review the data and document corrective actions. Compare results with the baseline after process changes, maintenance work, or control adjustments. The DOE’s industrial energy management guidance recommends ongoing monitoring and analysis as part of continual improvement; the same discipline makes an energy dashboard useful after the installation team leaves.
For project teams evaluating meter options, CHINT’s DTSU666-CT product information and PD7777 panel meter specifications provide model-specific measurement and communication details. Confirm the exact model, CT arrangement, regional approvals, and register map with CHINT before procurement.
Conclusion
Reliable industrial energy monitoring starts with a clear question, a defined measurement boundary, and instruments suited to the electrical system. Meter the loads that matter, validate the data, and connect trends to production and operating schedules. With that foundation, energy teams can find avoidable baseload, investigate demand peaks, and track whether corrective work delivers a sustained result.
Frequently Asked Questions
How many meters does an industrial facility need?
There is no fixed number. Begin with the main incomer and the largest loads or process areas that can support a real operating decision. Expand after the first phase shows which additional measurements would be useful.
Can an energy meter show which machine is wasting energy?
A meter can show a circuit’s consumption and electrical behavior, but it does not diagnose a mechanical or process fault on its own. Pair the readings with equipment state, production records, and inspection findings to identify the cause.
What is the difference between an energy meter and a power quality analyzer?
An energy meter is generally used for energy and operating measurements such as kWh, kW, voltage, current, and power factor. A power quality analyzer is selected when the project requires deeper event capture or compliance-grade analysis of disturbances; verify the required measurement methods and class against the applicable specification.
Does Modbus-RTU connect directly to every energy dashboard?
No. The meter, gateway, and software must agree on the physical interface, protocol settings, register addresses, data types, scaling, and polling behavior. Test the complete path before commissioning a large network.
How can a facility verify that energy savings are real?
Compare measured energy with a documented baseline while accounting for production volume, operating hours, weather, and material changes where they affect use. Keep the measurement boundary and calculation method consistent, and record when corrective actions were implemented.